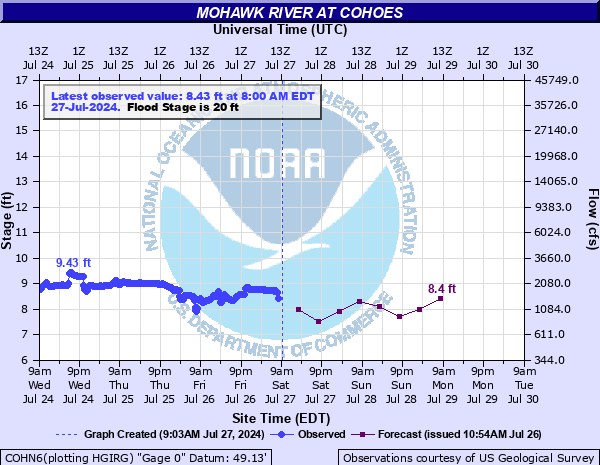
Mohawk River at Cohoes
Track river levels in and around Colonie, NY
Latest Observation
2:00am EDT -- July 13, 2026
Current Stage:
7.77 ft
Current Flow:
944.00 cfs
Historic Observations
Most significant stages and flows
Record Stage:
23.15 ft
Record Flow:
143,000.00 cfs
Flood Stage Categories
Benchmarks that define rising river impacts
Action: 17.0 ft
Minor: 20.0 ft
Moderate: 21.0 ft
Major: 22.0 ft
| Time/Date | Stage | Flow | Category |
|---|---|---|---|
| 8:00am EDT -- July 13, 2026 | 8.10 ft | 1,160.00 cfs | Normal |
| 2:00pm EDT -- July 13, 2026 | 8.10 ft | 1,160.00 cfs | Normal |
| 8:00pm EDT -- July 13, 2026 | 8.10 ft | 1,160.00 cfs | Normal |
| 2:00am EDT -- July 14, 2026 | 8.10 ft | 1,160.00 cfs | Normal |
| 8:00am EDT -- July 14, 2026 | 8.40 ft | 1,420.00 cfs | Normal |
| 2:00pm EDT -- July 14, 2026 | 8.30 ft | 1,330.00 cfs | Normal |
| 8:00pm EDT -- July 14, 2026 | 8.10 ft | 1,160.00 cfs | Normal |
| Time/Date | Stage | Flow | Category |
|---|---|---|---|
| 1:45am EDT -- July 13, 2026 | 7.77 ft | 944.00 cfs | Normal |
| 1:30am EDT -- July 13, 2026 | 7.78 ft | 949.00 cfs | Normal |
| 1:15am EDT -- July 13, 2026 | 7.78 ft | 949.00 cfs | Normal |
| 1:00am EDT -- July 13, 2026 | 7.79 ft | 955.00 cfs | Normal |
| 12:45am EDT -- July 13, 2026 | 7.79 ft | 955.00 cfs | Normal |
| 12:30am EDT -- July 13, 2026 | 7.79 ft | 955.00 cfs | Normal |
| 12:15am EDT -- July 13, 2026 | 7.78 ft | 949.00 cfs | Normal |
| 12:00am EDT -- July 13, 2026 | 7.78 ft | 949.00 cfs | Normal |
| 11:45pm EDT -- July 12, 2026 | 7.80 ft | 961.00 cfs | Normal |
| 11:30pm EDT -- July 12, 2026 | 7.84 ft | 985.00 cfs | Normal |
Normal: The water surface is below the top of its banks.
Action: The water surface is generally near or slightly above the top of its banks, but no man-made structures are flooded.
Minor: Minimal or no property damage, but possibly some public threat (e.g., inundation of roads).
Moderate: Some inundation of structures and roads near stream. Some evacuations of people and/or transfer of property to higher elevations.
Major: Extensive inundation of structures and roads. Significant evacuations of people and/or transfer of property to higher elevations.
Flood Stage Impacts
22.00 ft.: Major flood stage.
21.00 ft.: Moderate flood stage.
20.00 ft.: Minor flood stage.
17.50 ft.: The river is bankfull at Schenectady.
17.00 ft.: Action stage.
Hydrograph
Gauge Location
Source National Water Prediction Service