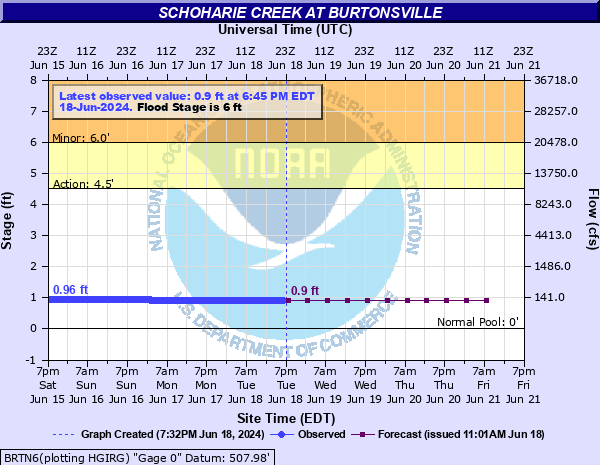
Schoharie Creek at Burtonsville
Track river levels in and around Colonie, NY
Latest Observation
12:45am EDT -- July 13, 2026
Current Stage:
0.84 ft
Current Flow:
73.10 cfs
Historic Observations
Most significant stages and flows
Record Stage:
17.46 ft
Record Flow:
128,000.00 cfs
Flood Stage Categories
Benchmarks that define rising river impacts
Action: 4.5 ft
Minor: 6.0 ft
Moderate: 8.0 ft
Major: 10.0 ft
| Time/Date | Stage | Flow | Category |
|---|---|---|---|
| 2:00am EDT -- July 13, 2026 | 0.80 ft | 59.00 cfs | Normal |
| 8:00am EDT -- July 13, 2026 | 0.80 ft | 59.00 cfs | Normal |
| 2:00pm EDT -- July 13, 2026 | 0.80 ft | 59.00 cfs | Normal |
| 8:00pm EDT -- July 13, 2026 | 0.80 ft | 59.00 cfs | Normal |
| 2:00am EDT -- July 14, 2026 | 0.80 ft | 59.00 cfs | Normal |
| 8:00am EDT -- July 14, 2026 | 0.80 ft | 59.00 cfs | Normal |
| 2:00pm EDT -- July 14, 2026 | 0.80 ft | 59.00 cfs | Normal |
| Time/Date | Stage | Flow | Category |
|---|---|---|---|
| 12:30am EDT -- July 13, 2026 | 0.84 ft | 73.10 cfs | Normal |
| 12:15am EDT -- July 13, 2026 | 0.84 ft | 73.10 cfs | Normal |
| 12:00am EDT -- July 13, 2026 | 0.84 ft | 73.10 cfs | Normal |
| 11:45pm EDT -- July 12, 2026 | 0.84 ft | 73.10 cfs | Normal |
| 11:30pm EDT -- July 12, 2026 | 0.84 ft | 73.10 cfs | Normal |
| 11:15pm EDT -- July 12, 2026 | 0.84 ft | 73.10 cfs | Normal |
| 11:00pm EDT -- July 12, 2026 | 0.84 ft | 73.10 cfs | Normal |
| 10:45pm EDT -- July 12, 2026 | 0.84 ft | 73.10 cfs | Normal |
| 10:30pm EDT -- July 12, 2026 | 0.84 ft | 73.10 cfs | Normal |
| 10:15pm EDT -- July 12, 2026 | 0.84 ft | 73.10 cfs | Normal |
Normal: The water surface is below the top of its banks.
Action: The water surface is generally near or slightly above the top of its banks, but no man-made structures are flooded.
Minor: Minimal or no property damage, but possibly some public threat (e.g., inundation of roads).
Moderate: Some inundation of structures and roads near stream. Some evacuations of people and/or transfer of property to higher elevations.
Major: Extensive inundation of structures and roads. Significant evacuations of people and/or transfer of property to higher elevations.
Flood Stage Impacts
17.46 ft.: Record flood with Tropical Storm Irene in August 2011. Widespread flooding in the region. Water reaches the Mill Point bridge.
10.00 ft.: Major flood stage.
8.00 ft.: Moderate flood stage. Water reaches homes in Lost Valley along Island Road.
7.00 ft.: Water reaches Priddle Camp Road.
6.00 ft.: Minor flood stage. Water reaches lowest houses in Burtonsville.
5.00 ft.: The river is nearly bankfull and portions of Island Road in the Lost Valley community are inundated.
4.50 ft.: Action stage. Water reaches Island Road in the Lost Valley community.
Hydrograph
Gauge Location
Source National Water Prediction Service