Schoharie Creek at Burtonsville Gauge
Last Update:
7:45pm EDT -- July 11, 2025
Page automatically refreshes every 15 minutes.
Latest Observation
Normal
Current Stage:
0.88 ft
Current Flow: 89.70 cfs
Historic Observations
Record Stage:
17.46 ft
Record Flow:
128,000.00 cfs
| Time/Date | Stage | Flow | Category |
|---|---|---|---|
| 2:00am EDT -- July 12, 2025 | 0.90 ft | 99.00 cfs | Normal |
| 8:00am EDT -- July 12, 2025 | 0.90 ft | 99.00 cfs | Normal |
| 2:00pm EDT -- July 12, 2025 | 0.90 ft | 99.00 cfs | Normal |
| 8:00pm EDT -- July 12, 2025 | 0.90 ft | 99.00 cfs | Normal |
| 2:00am EDT -- July 13, 2025 | 0.90 ft | 99.00 cfs | Normal |
| 8:00am EDT -- July 13, 2025 | 0.90 ft | 99.00 cfs | Normal |
| 2:00pm EDT -- July 13, 2025 | 0.90 ft | 99.00 cfs | Normal |
| Time/Date | Stage | Flow | Category |
|---|---|---|---|
| 7:30pm EDT -- July 11, 2025 | 0.88 ft | 89.70 cfs | Normal |
| 7:15pm EDT -- July 11, 2025 | 0.88 ft | 89.70 cfs | Normal |
| 7:00pm EDT -- July 11, 2025 | 0.88 ft | 89.70 cfs | Normal |
| 6:45pm EDT -- July 11, 2025 | 0.88 ft | 89.70 cfs | Normal |
| 6:30pm EDT -- July 11, 2025 | 0.88 ft | 89.70 cfs | Normal |
| 6:15pm EDT -- July 11, 2025 | 0.88 ft | 89.70 cfs | Normal |
| 6:00pm EDT -- July 11, 2025 | 0.88 ft | 89.70 cfs | Normal |
| 5:45pm EDT -- July 11, 2025 | 0.88 ft | 89.70 cfs | Normal |
| 5:30pm EDT -- July 11, 2025 | 0.88 ft | 89.70 cfs | Normal |
| 5:15pm EDT -- July 11, 2025 | 0.88 ft | 89.70 cfs | Normal |
Normal: The water surface is below the top of its banks.
Action: The water surface is generally near or slightly above the top of its banks, but no man-made structures are flooded.
Minor: Minimal or no property damage, but possibly some public threat (e.g., inundation of roads).
Moderate: Some inundation of structures and roads near stream. Some evacuations of people and/or transfer of property to higher elevations.
Major: Extensive inundation of structures and roads. Significant evacuations of people and/or transfer of property to higher elevations.
Flood Stage Impacts
17.46 ft.: Record flood with Tropical Storm Irene in August 2011. Widespread flooding in the region. Water reaches the Mill Point bridge.
10.00 ft.: Major flood stage.
8.00 ft.: Moderate flood stage. Water reaches homes in Lost Valley along Island Road.
7.00 ft.: Water reaches Priddle Camp Road.
6.00 ft.: Minor flood stage. Water reaches lowest houses in Burtonsville.
5.00 ft.: The river is nearly bankfull and portions of Island Road in the Lost Valley community are inundated.
4.50 ft.: Action stage. Water reaches Island Road in the Lost Valley community.
Hydrograph
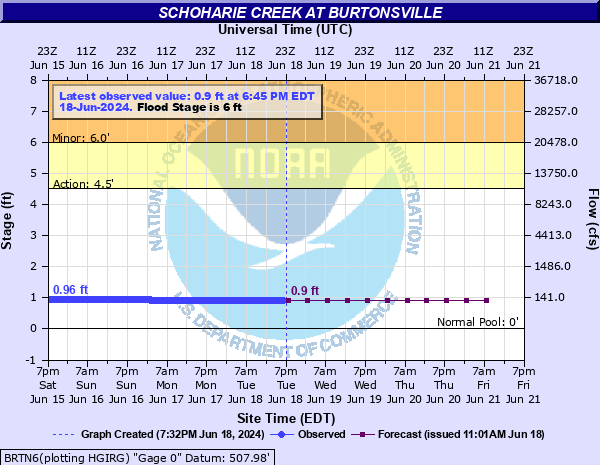
Gauge reading affected by reservoir operations.
Gauge reading may be affected by ice. Forecast flows are unadjusted for ice.
Forecasts are issued routinely year-round.
Source National Water Prediction Service / US Geological Survey