Typical Cyclone Tracks & Origins
Tropic Resources:
Sea Temperatures | Cyclone Names | Category Fives |
Intense/Costliest | Typical Cyclone Tracks | Landfalling Hurricanes
Sea Temperatures | Cyclone Names | Category Fives |
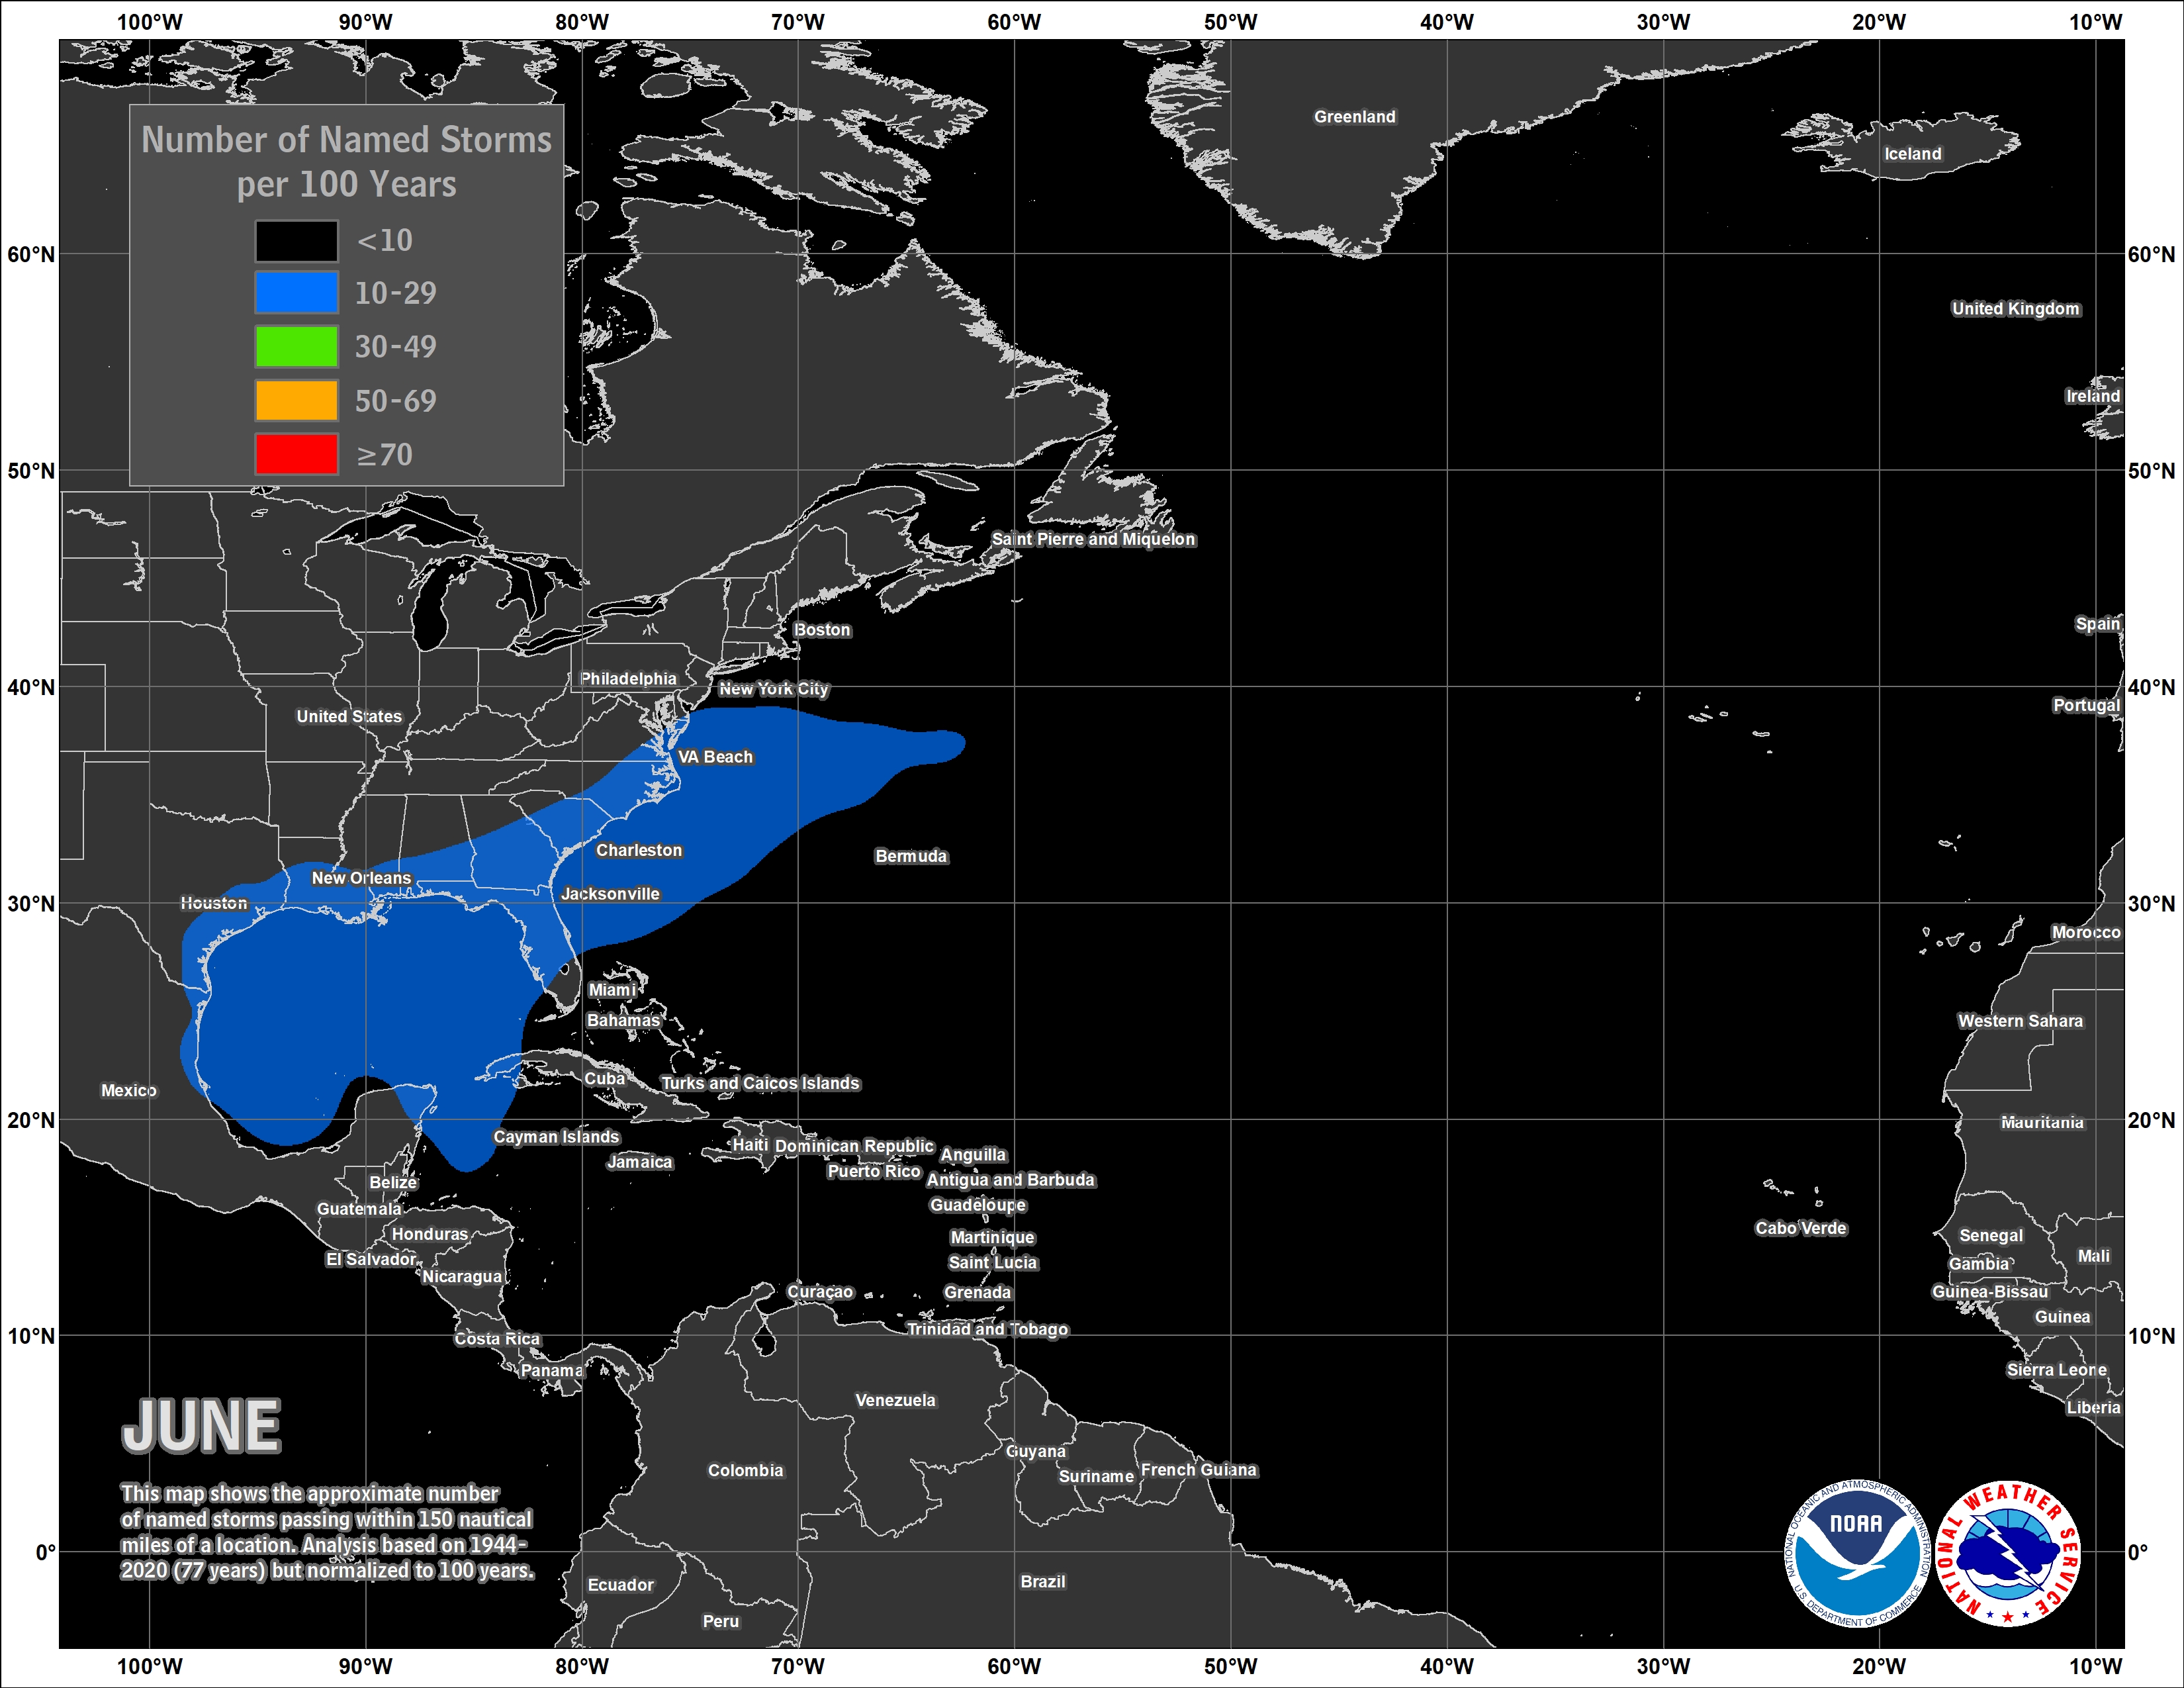
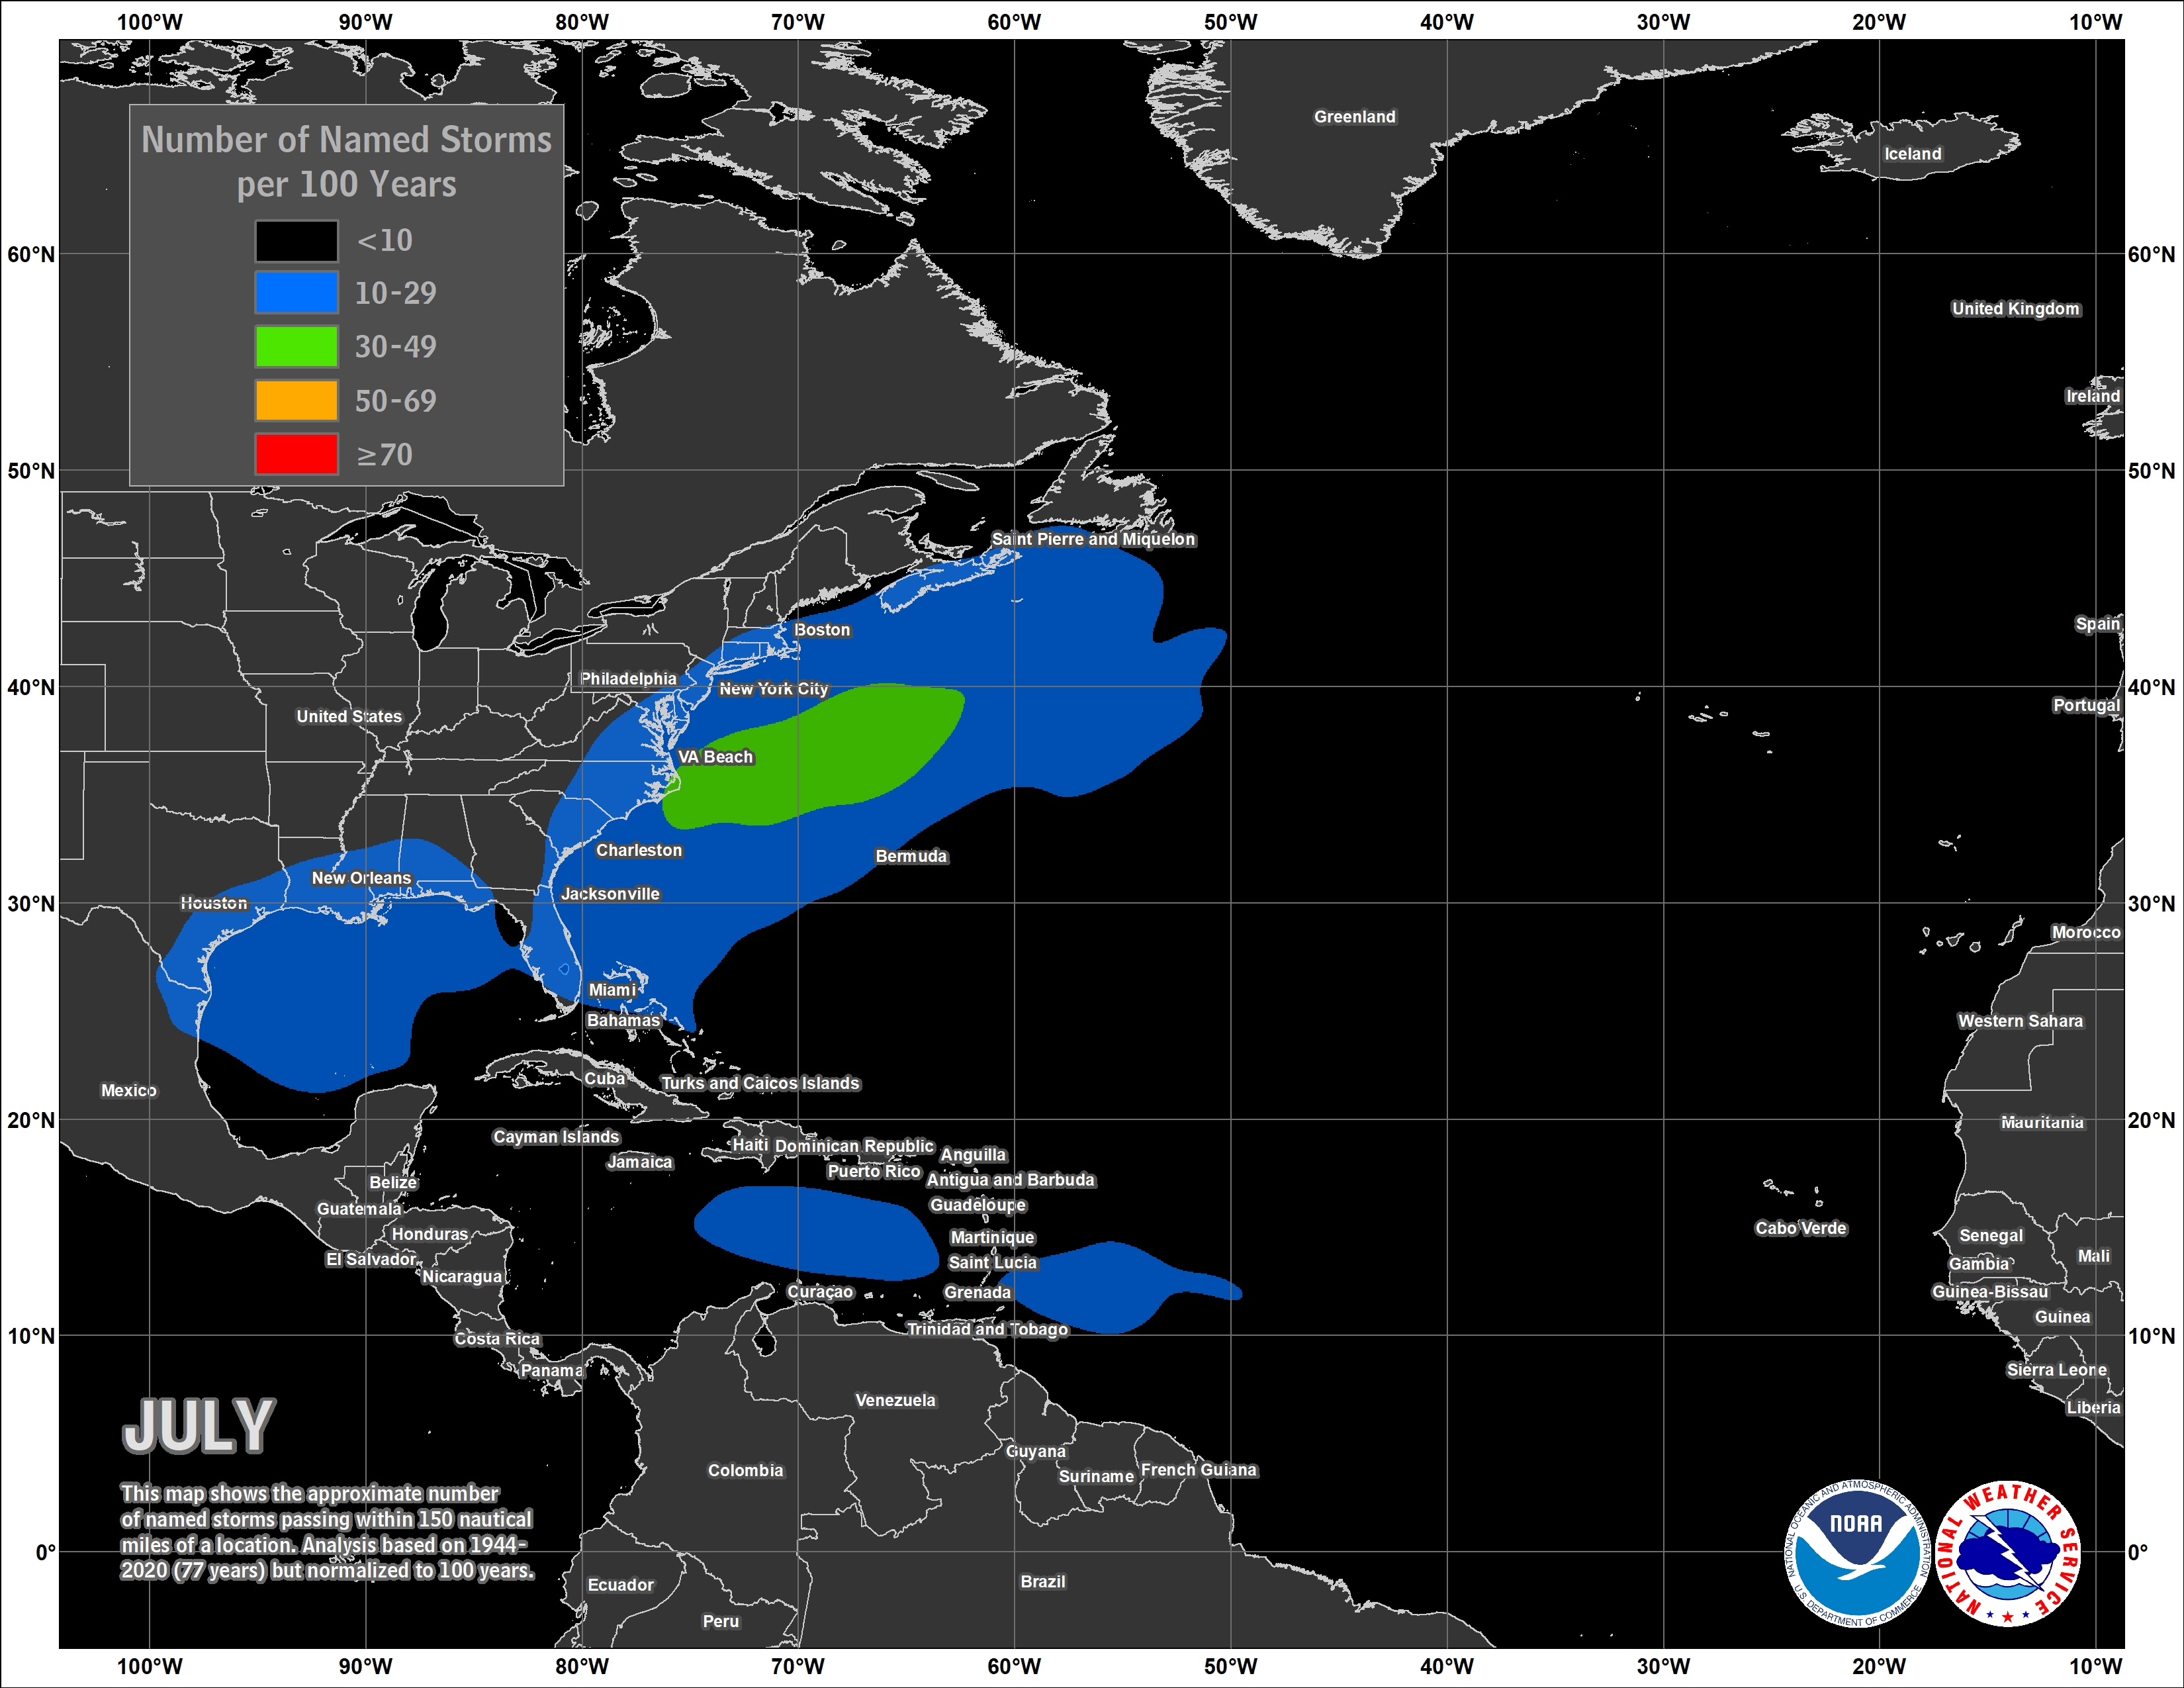
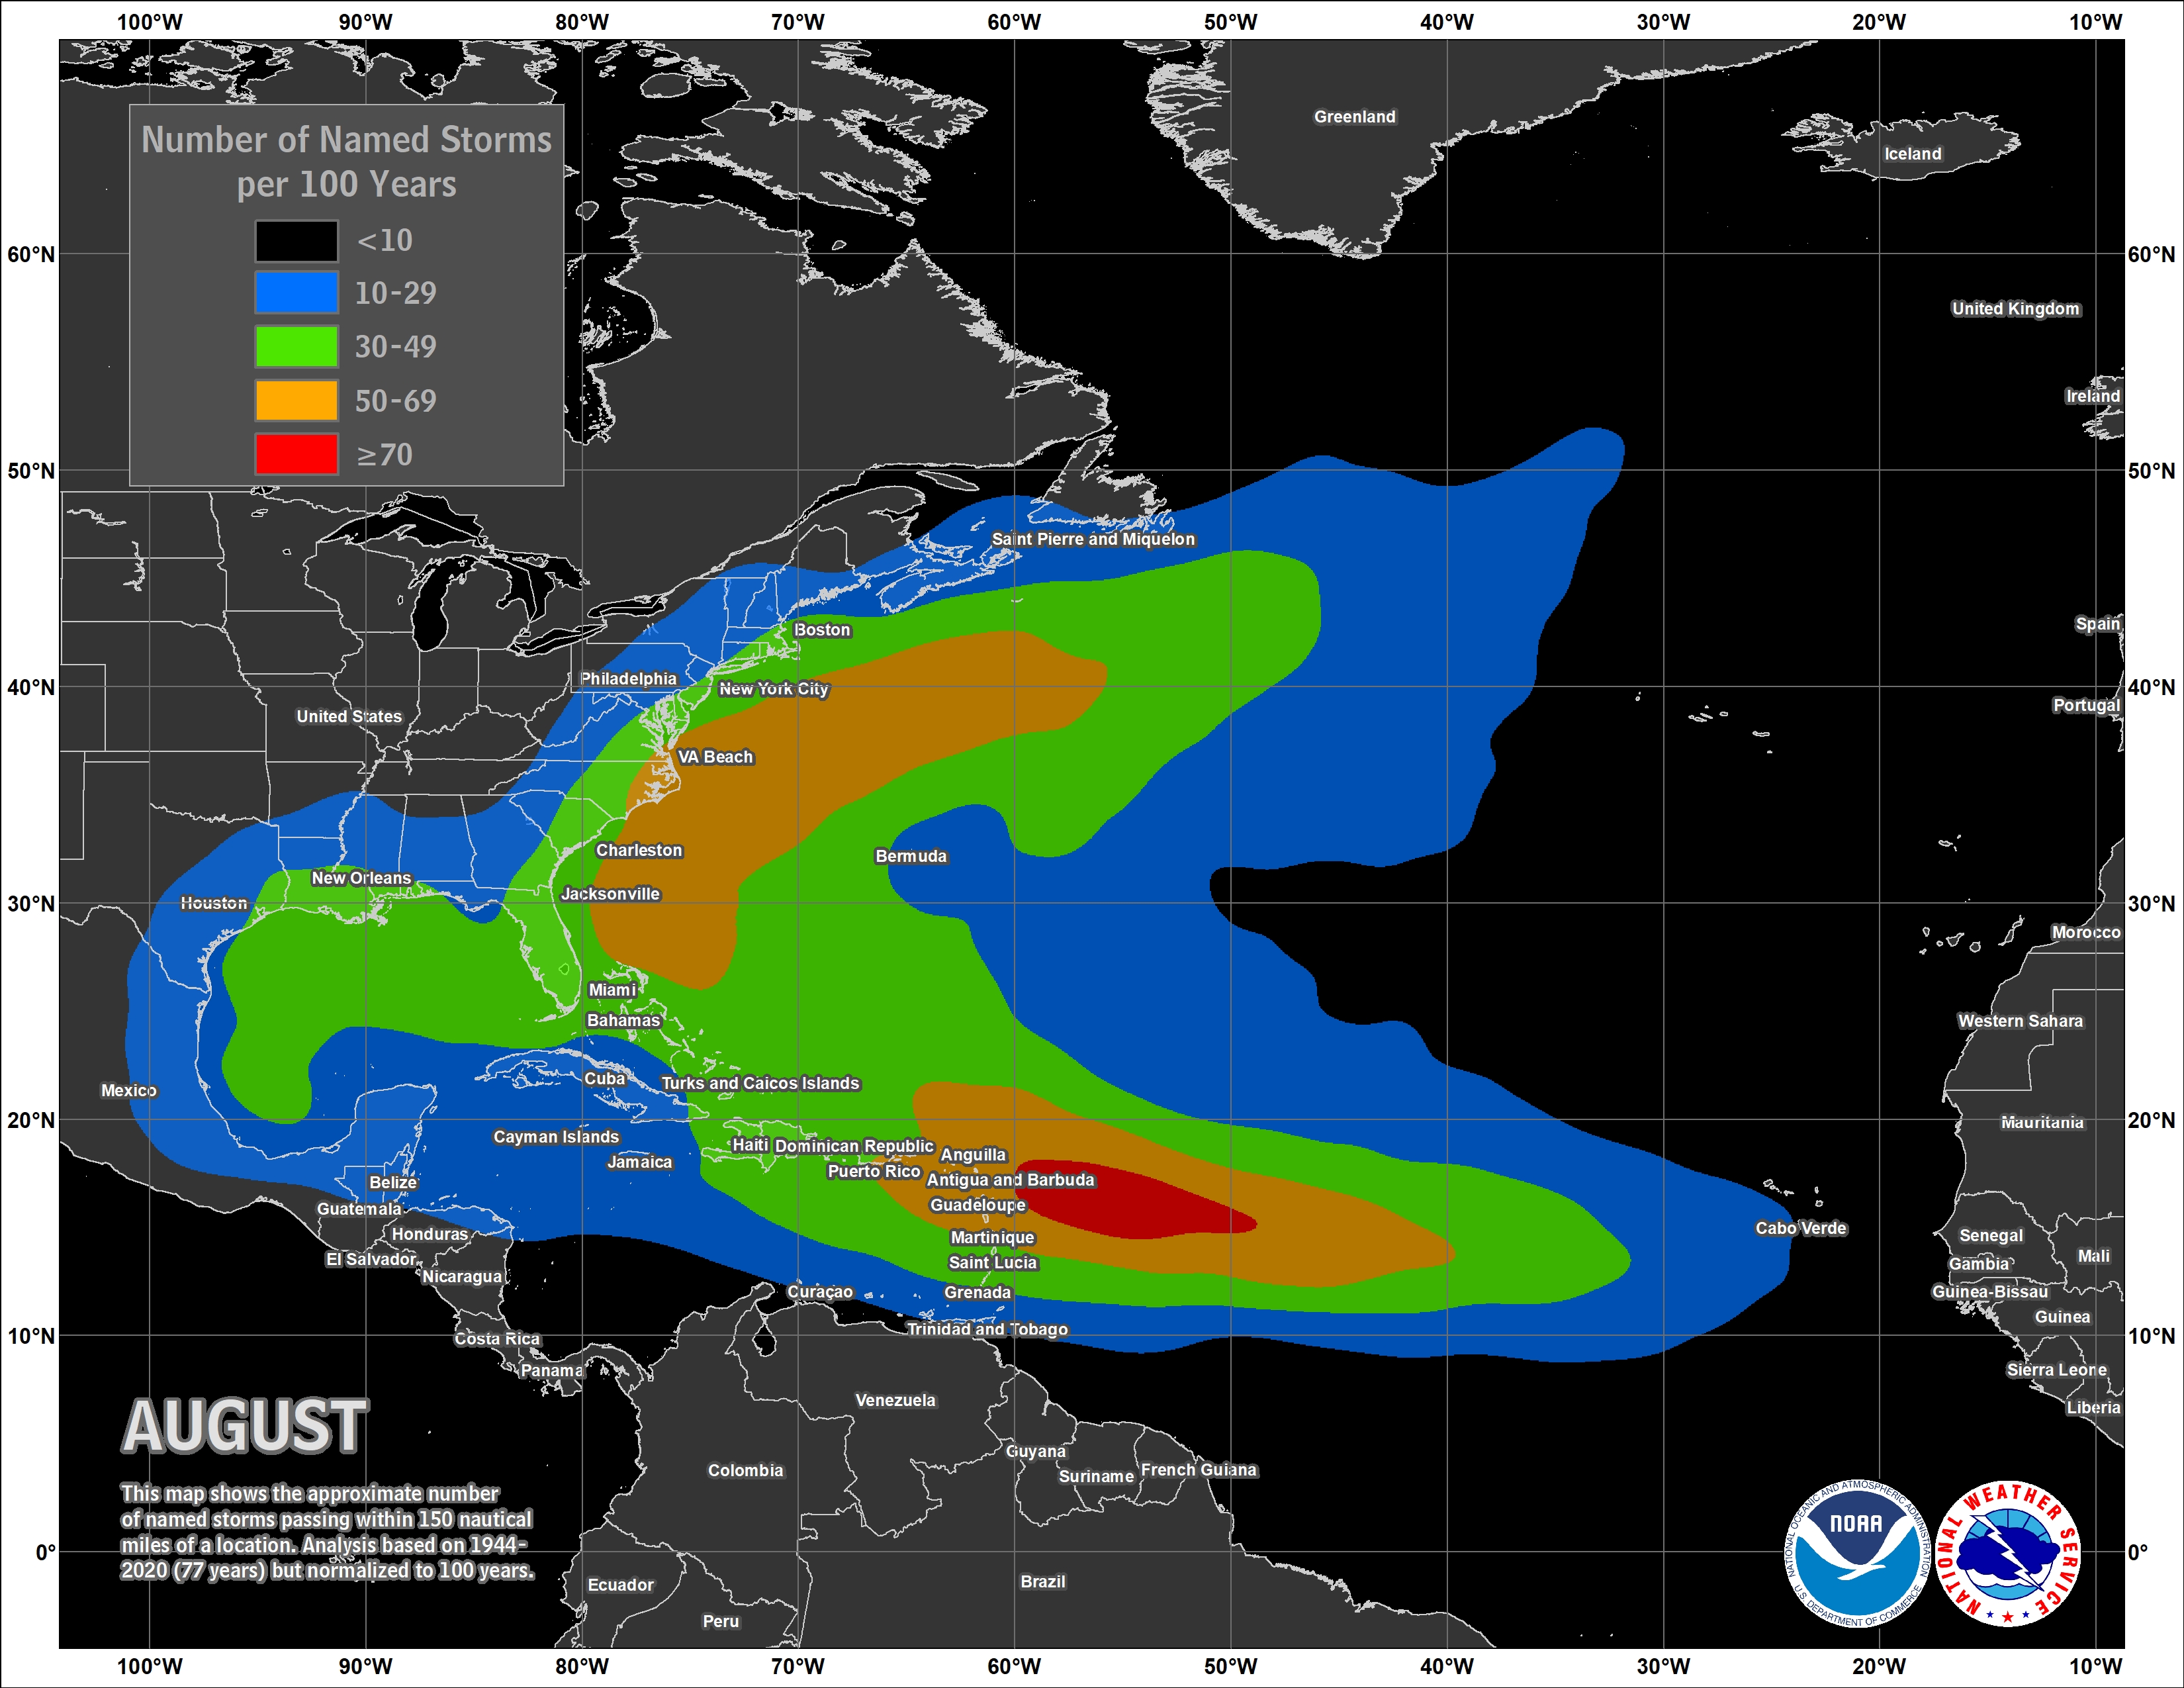
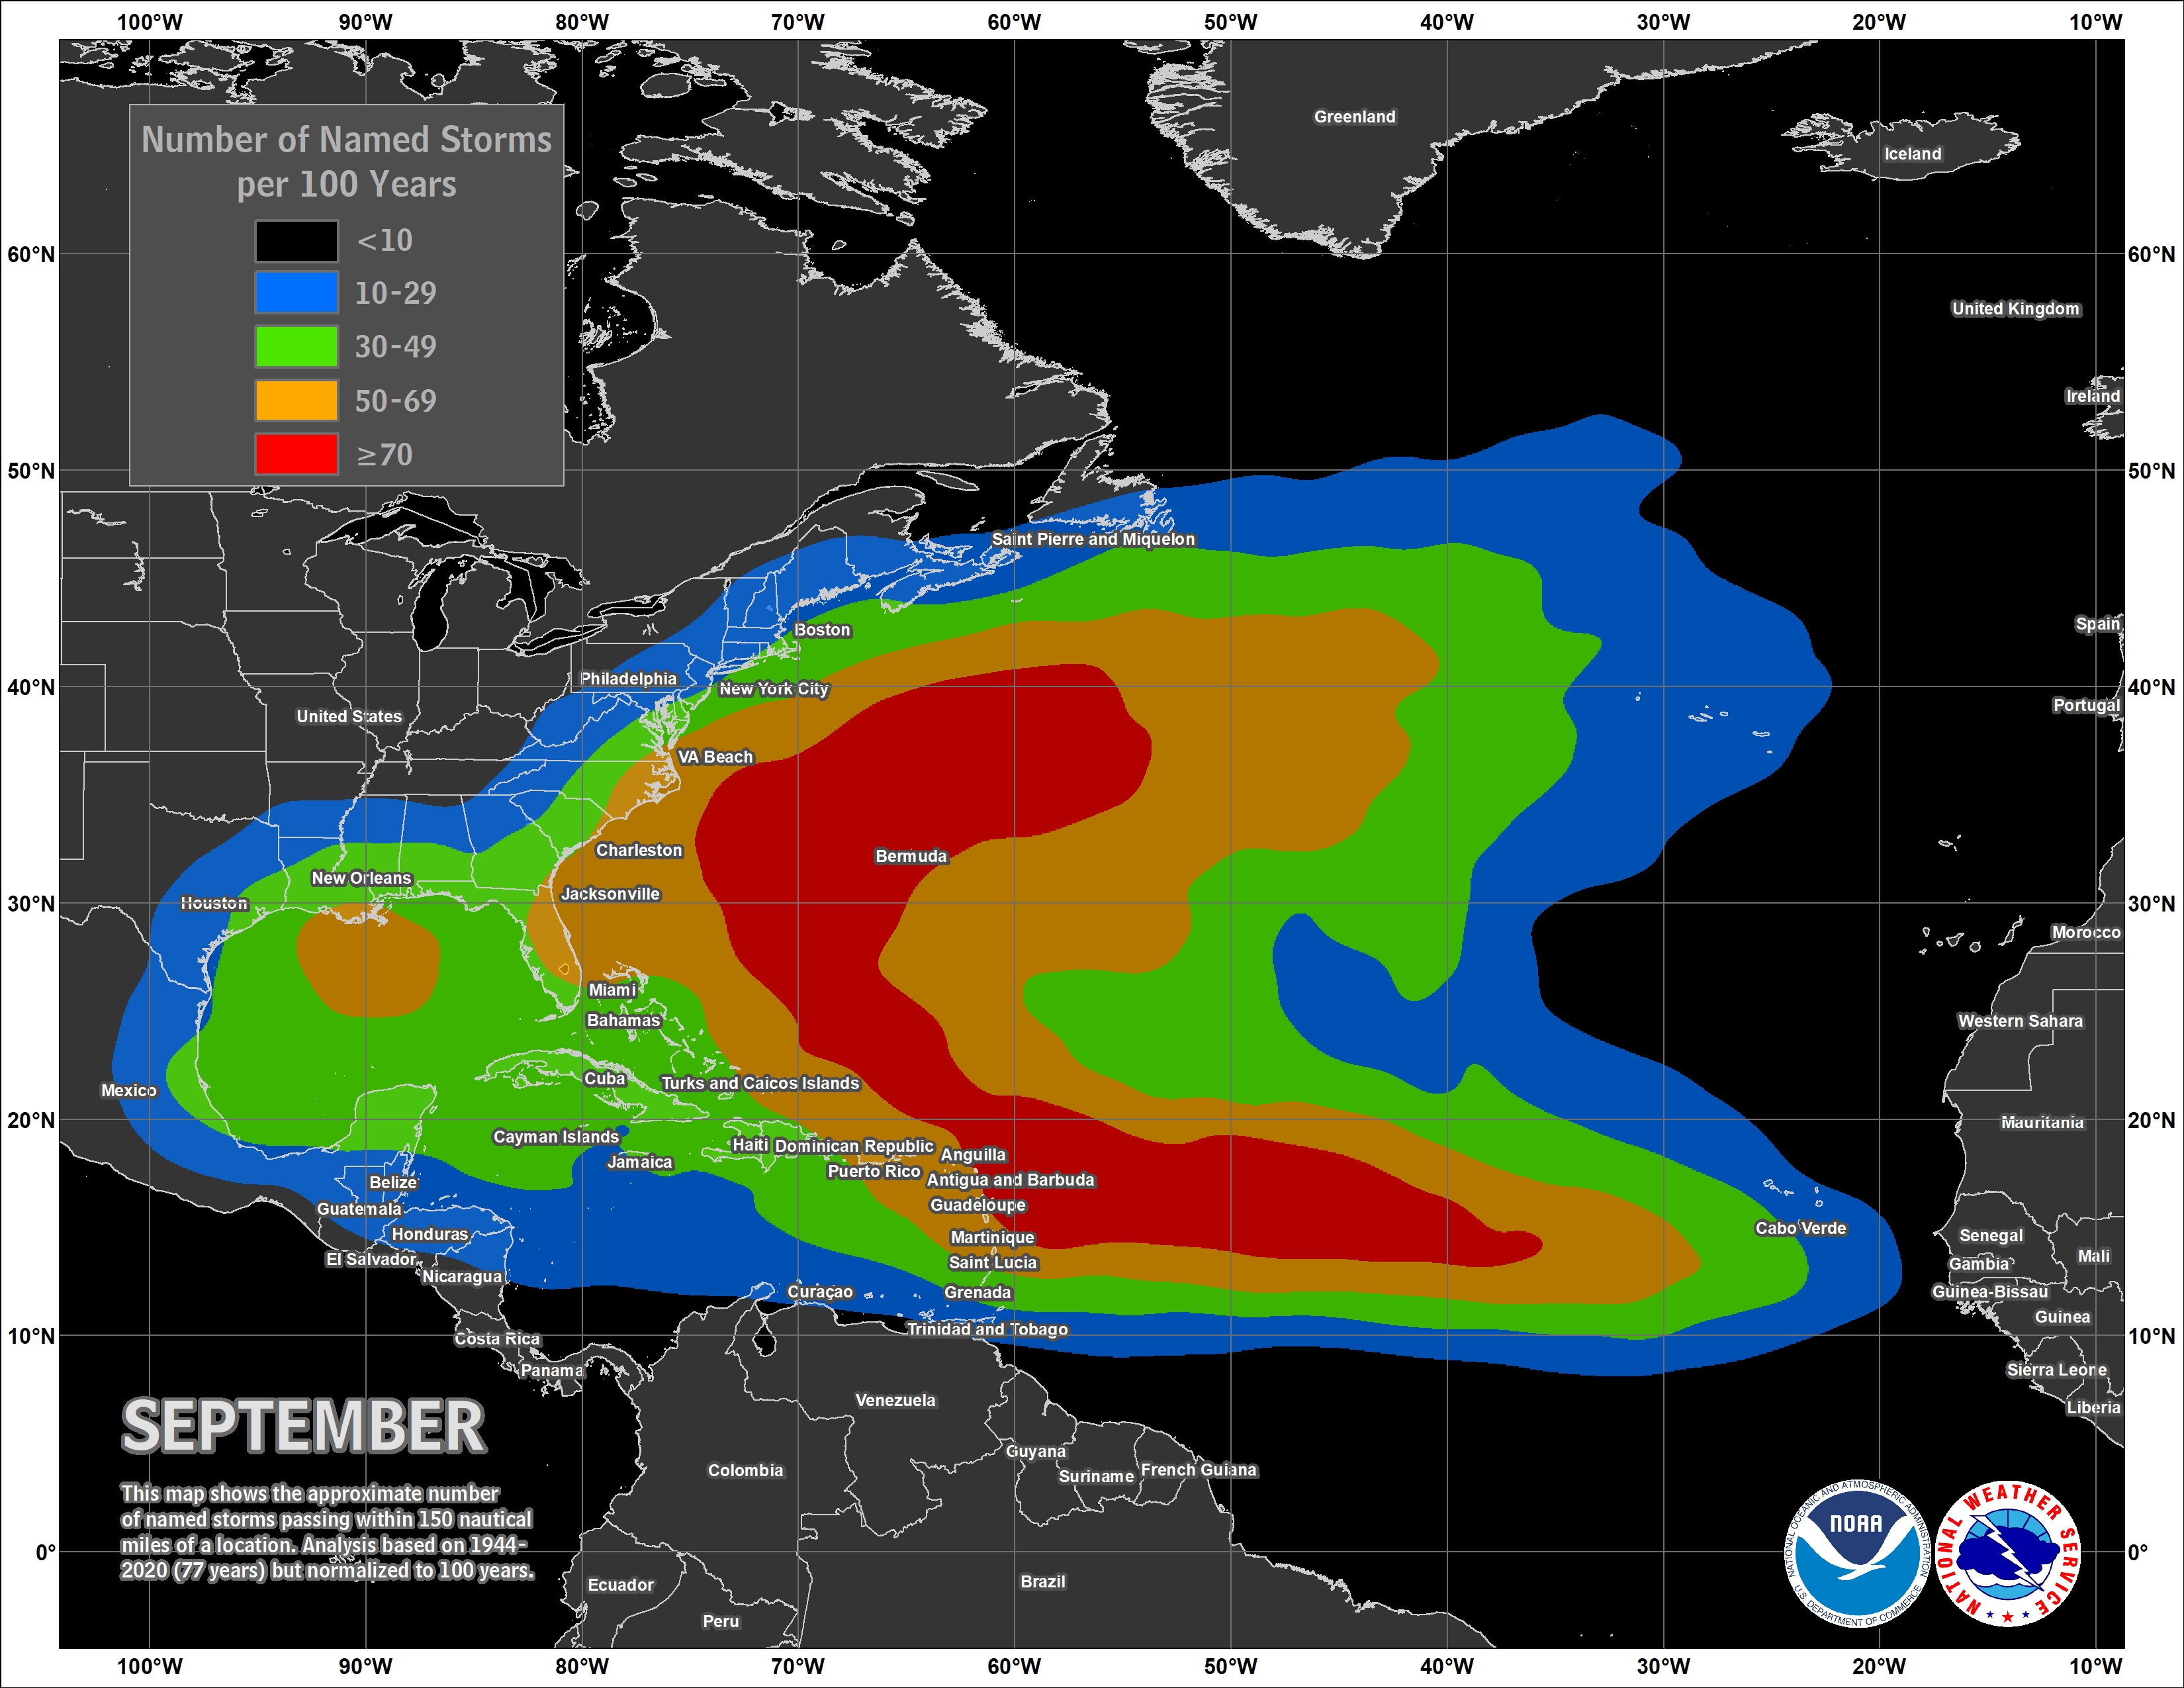
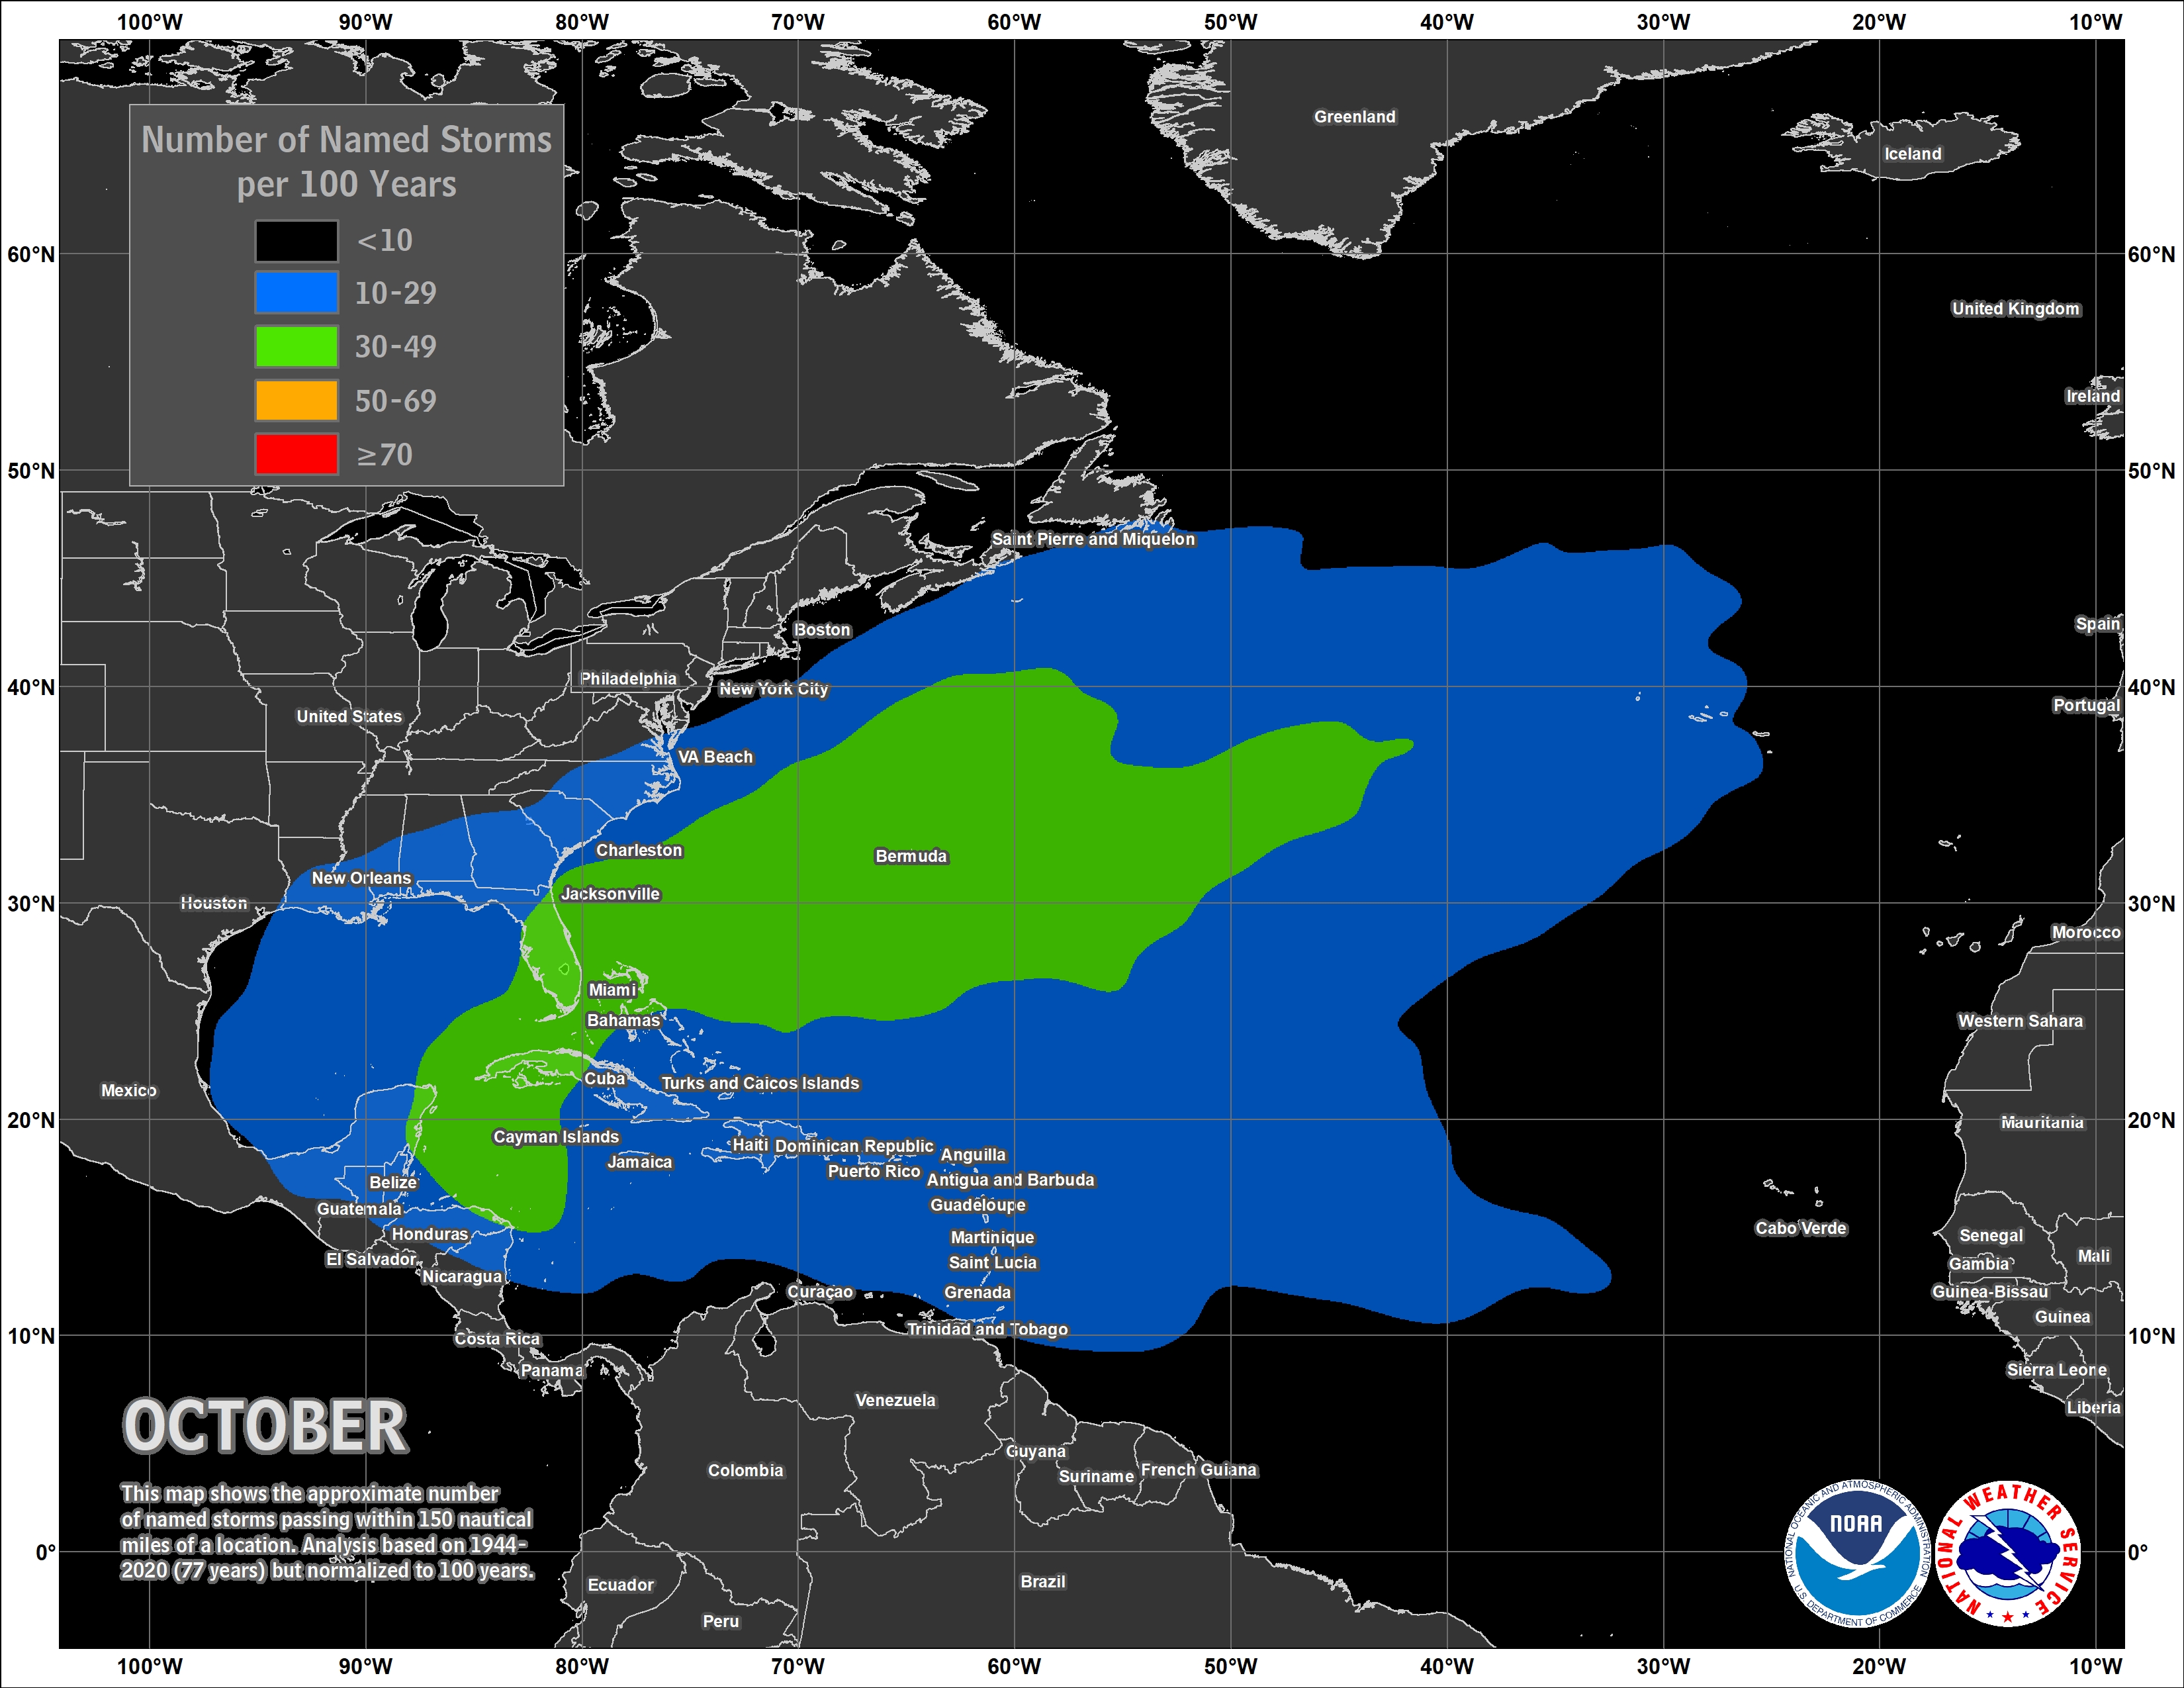
The figures below show the zones of origin and tracks.
June
July
August
September
October
November
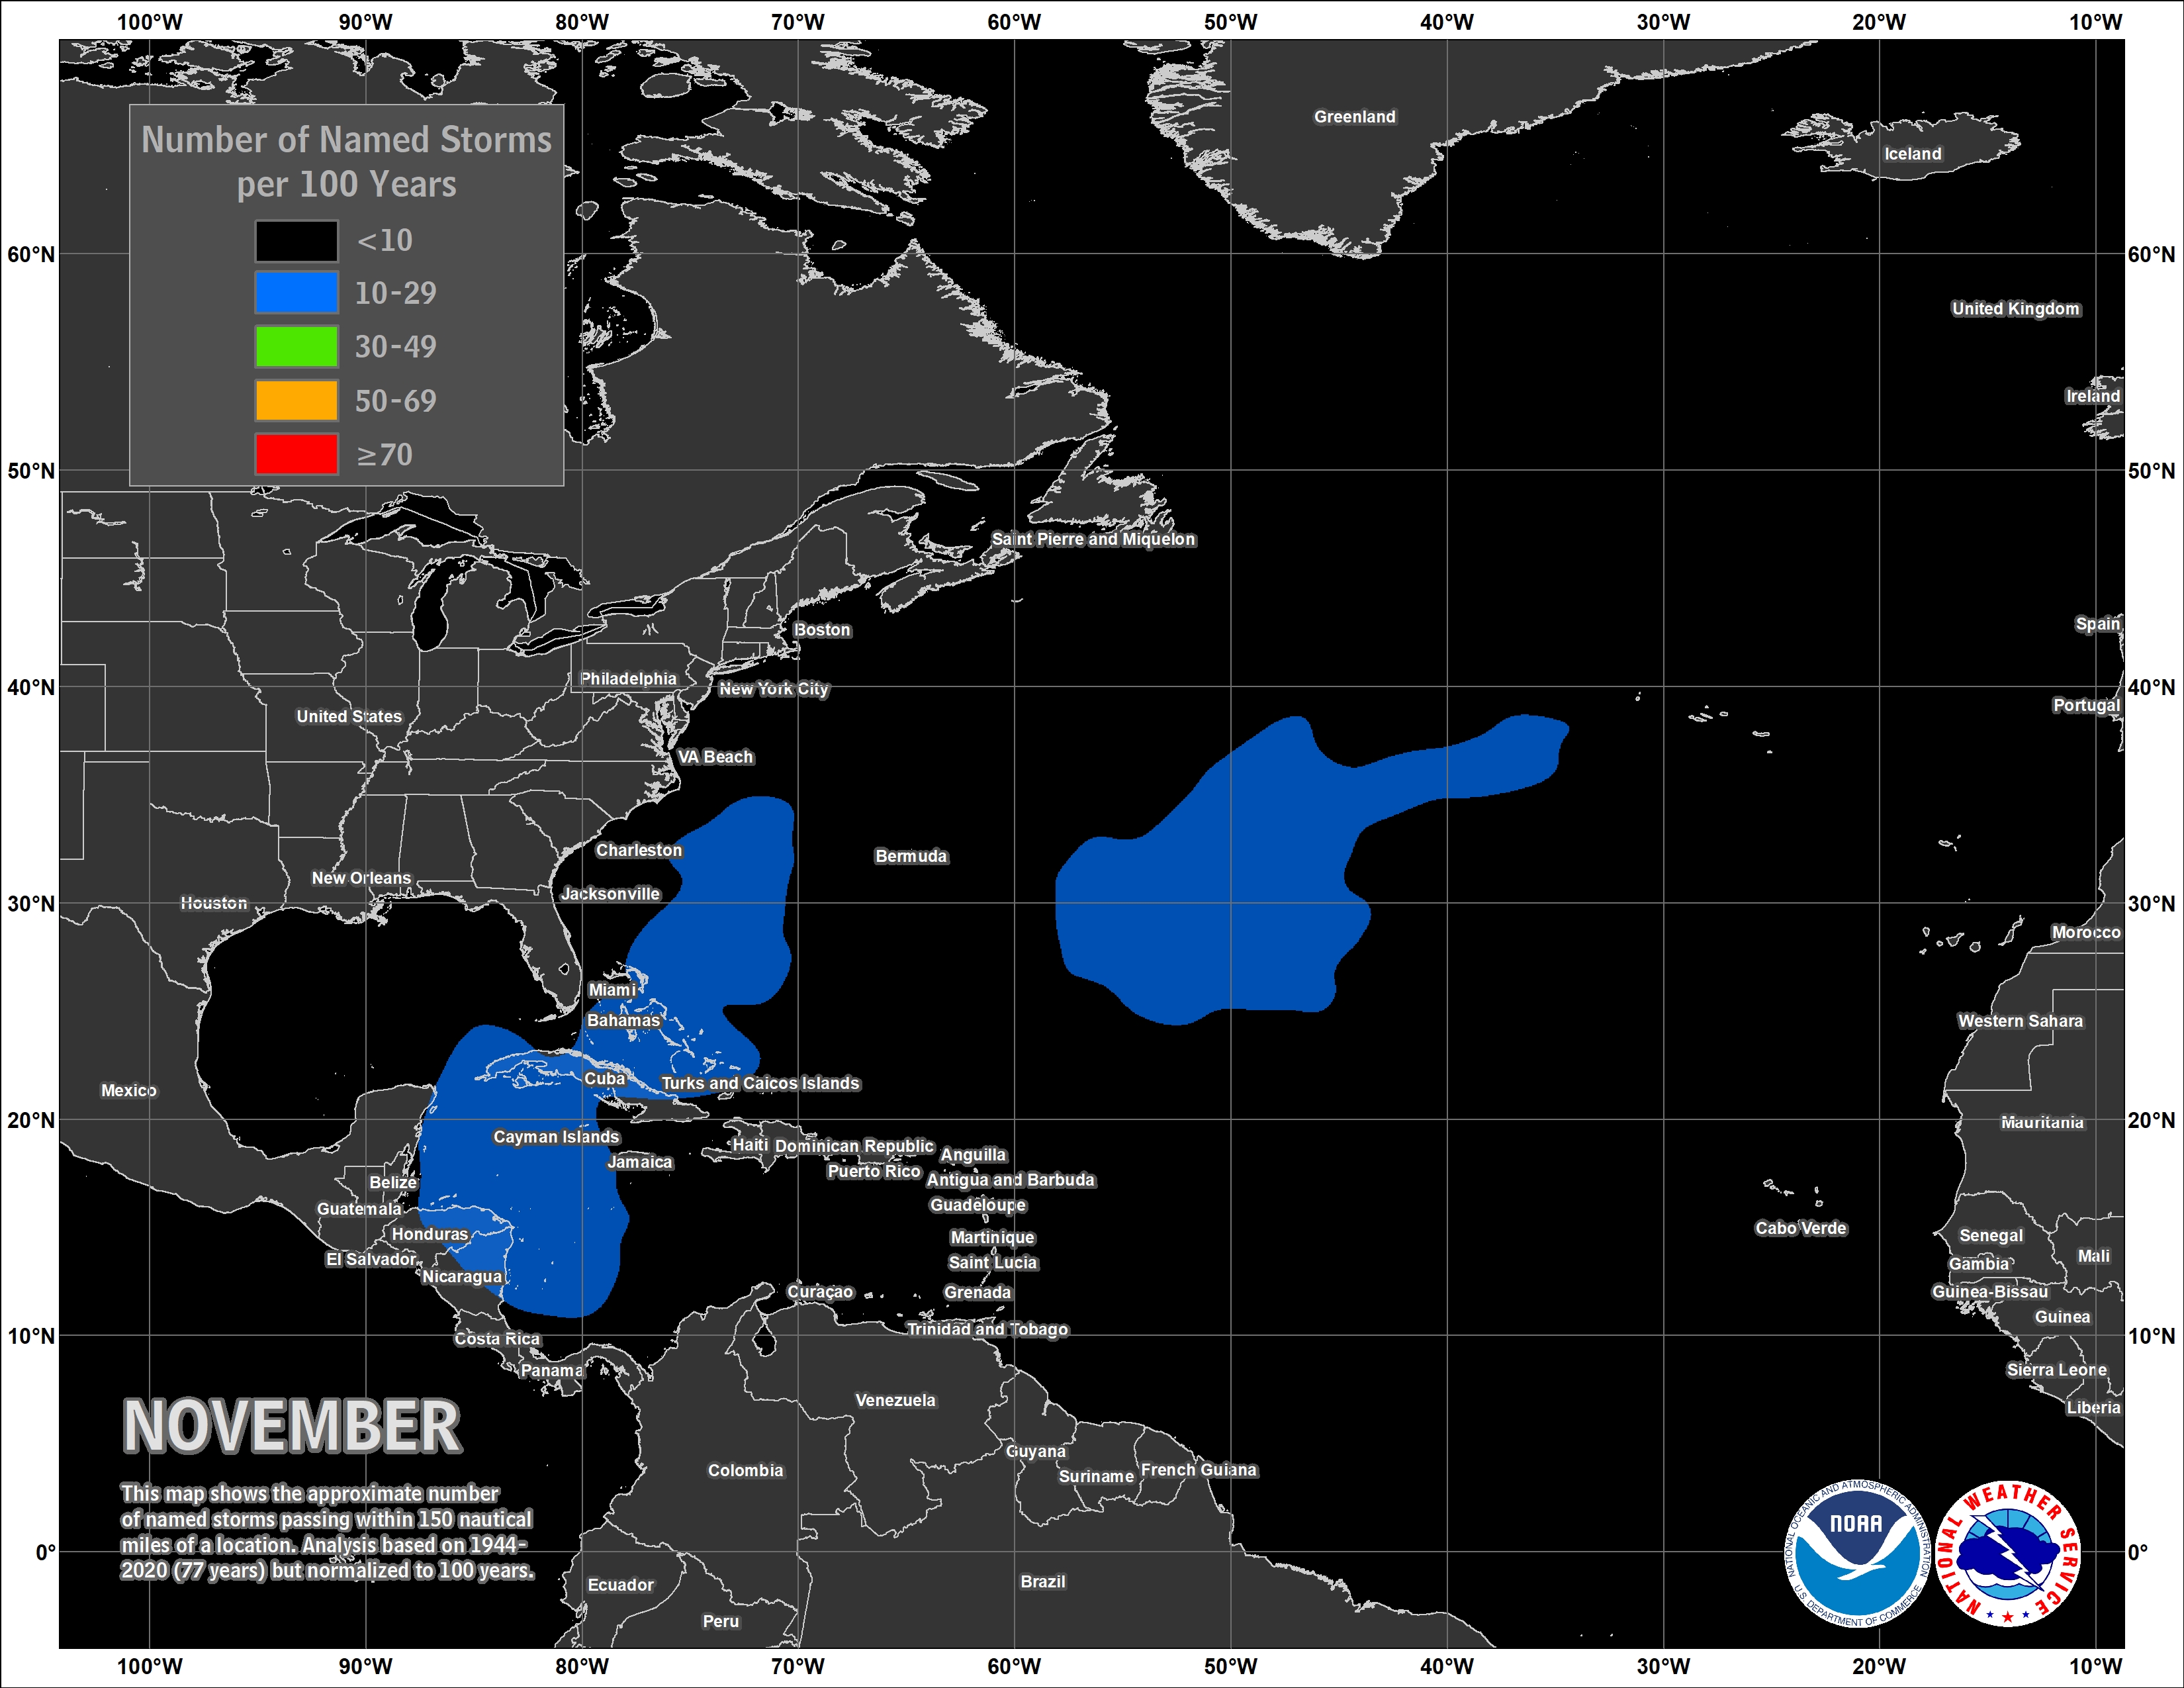
These maps show where tropical cyclones (named storms and hurricanes) tend to occur during each month of the hurricane season. The data are shown as the number of named storms or hurricanes whose centers pass within 150 nautical miles of a point on the map during a 100-year period. The analyses are based on data from the 77-year period from 1944 to 2020 (starting at the beginning of the aircraft reconnaissance era) but normalized to 100 years.
Source National Hurricane Center