Space Weather
Tracking the Sun’s influence on life here at home
Estimated Planetary K-index (Kp)
7:00am EST -- February 16, 2026
Minor Activity
3.00
There is a 13% chance of viewing aurora.
Latest Observation Impacts
Highest observed impacts in the last hour.
24-Hour Observed Maximums
Highest observed impacts in the last 24 hours.
Solar Wind Speed: 606 km/s
Solar Wind Density: 1.33 cm3
Solar Wind Temperature: 168,915 K
Planetary K-index (Kp): Assesses the severity of disturbances in Earth's magnetic field caused by solar wind and other space weather phenomena.
Geomagnetic Storms (G): These storms are caused by disturbances in Earth's magnetic field due to solar wind and coronal mass ejections (CMEs).
Solar Radiation Storms (S): These storms involve high-energy particles (mostly protons) emitted by the Sun, which can affect satellites and astronauts.
Radio Blackouts (R): These are caused by solar flares emitting X-rays that disturb Earth's ionosphere, affecting radio communication.
Solar Wind Speed: How fast charged particles — mostly electrons and protons — stream from the Sun's outer atmosphere (the corona) into space.
Solar Wind Density: Number of charged particles — mostly protons and electrons — per cubic centimeter in the stream of plasma flowing from the Sun.
Solar Wind Temperature: Thermal energy of the charged particles — mostly electrons and protons — that stream from the Sun's corona into space.
Auroral Activity
Current Viewline

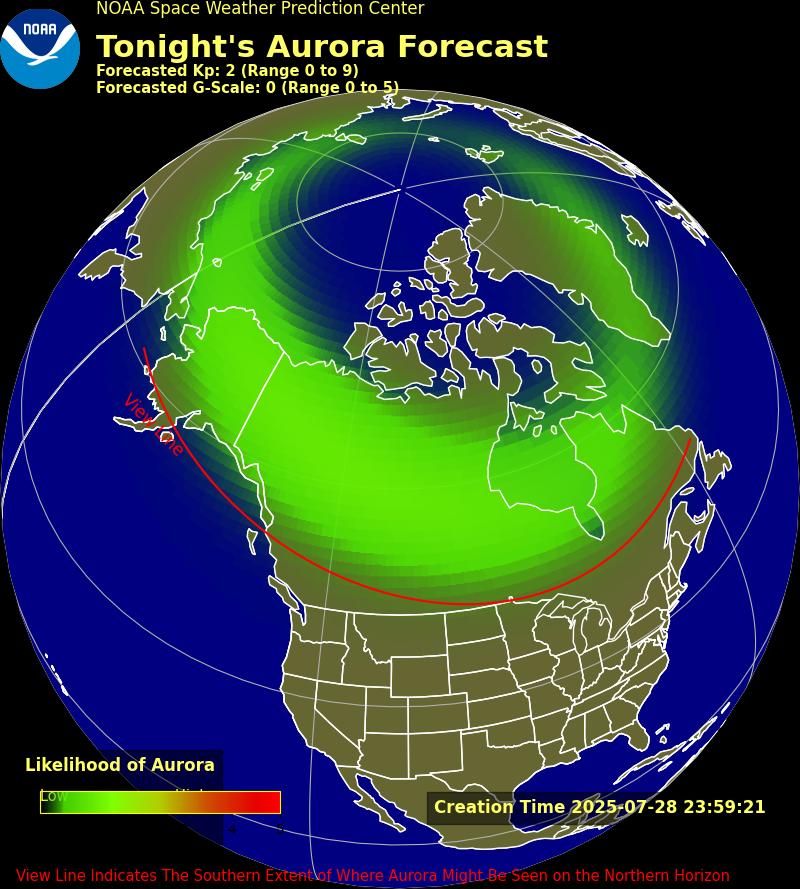
Tonight's Viewline
Tomorrow's Viewline
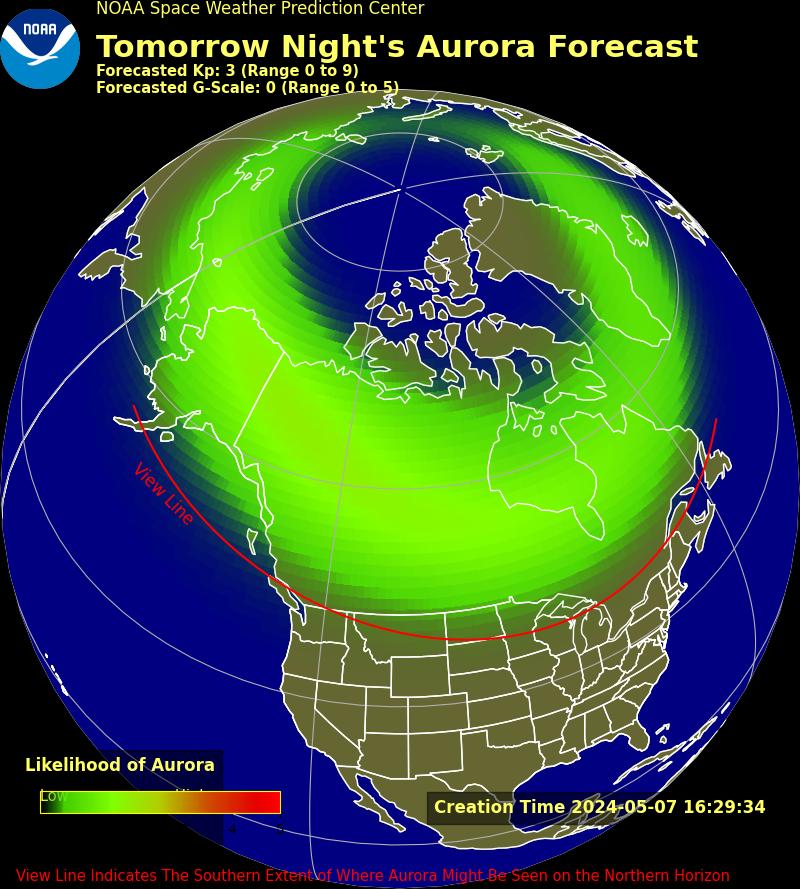
Instruments on board the NOAA Polar-orbiting Operational Environmental Satellite (POES) continually monitor the power flux carried by the protons and electrons that produce aurora in the atmosphere. SWPC has developed a technique that uses the power flux observations obtained during a single pass of the satellite over a polar region (which takes about 25 minutes) to estimate the total power deposited in an entire polar region by these auroral particles. The power input estimate is converted to an auroral activity index that ranges from 1 to 10.
| Time/Date | Kp Value | Kp Description | NOAA Scale |
|---|---|---|---|
| 7:00pm EST -- February 16, 2026 | 3.67 | Minor Activity | ---- |
| 10:00pm EST -- February 16, 2026 | 3.67 | Minor Activity | ---- |
| 1:00am EST -- February 17, 2026 | 2.67 | Minor Activity | ---- |
| 4:00am EST -- February 17, 2026 | 2.67 | Minor Activity | ---- |
| 7:00am EST -- February 17, 2026 | 2.00 | Quiet Conditions | ---- |
| 10:00am EST -- February 17, 2026 | 1.67 | Quiet Conditions | ---- |
| 1:00pm EST -- February 17, 2026 | 1.67 | Quiet Conditions | ---- |
| 4:00pm EST -- February 17, 2026 | 2.67 | Minor Activity | ---- |
| 7:00pm EST -- February 17, 2026 | 2.67 | Minor Activity | ---- |
| 10:00pm EST -- February 17, 2026 | 2.67 | Minor Activity | ---- |
| 1:00am EST -- February 18, 2026 | 2.67 | Minor Activity | ---- |
| 4:00am EST -- February 18, 2026 | 2.00 | Quiet Conditions | ---- |
| 7:00am EST -- February 18, 2026 | 2.00 | Quiet Conditions | ---- |
| 10:00am EST -- February 18, 2026 | 0.67 | Quiet Conditions | ---- |
| 1:00pm EST -- February 18, 2026 | 2.33 | Minor Activity | ---- |
| 4:00pm EST -- February 18, 2026 | 3.00 | Minor Activity | ---- |
| 7:00pm EST -- February 18, 2026 | 2.33 | Minor Activity | ---- |
Real-Time Images of the Sun
SOHO EIT 171
SOHO EIT 195
SOHO EIT 284
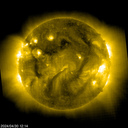
SOHO EIT 304
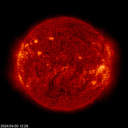
LASCO C2
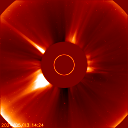
LASCO C3
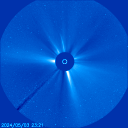
The sun is constantly monitored for sun spots coronal mass ejections . EIT (Extreme ultraviolet Imaging Telescope) images the solar atmosphere at several wavelengths, and therefore, shows solar material at different temperatures. In the images taken at 304 Angstrom the bright material is at 60,000 to 80,000 degrees Kelvin. In those taken at 171 Angstrom, at 1 million degrees. 195 Angstrom images correspond to about 1.5 million Kelvin, 284 Angstrom to 2 million degrees. The hotter the temperature, the higher you look in the solar atmosphere.
The Aurora Borealis (Northern Lights) and Aurora Australis (Southern Lights) are the result of electrons colliding with the upper reaches of Earth’s atmosphere. (Protons cause faint and diffuse aurora, usually not easily visible to the human eye.) The electrons are energized through acceleration processes in the downwind tail (night side) of the magnetosphere and at lower altitudes along auroral field lines. The accelerated electrons follow the magnetic field of Earth down to the Polar Regions where they collide with oxygen and nitrogen atoms and molecules in Earth’s upper atmosphere. In these collisions, the electrons transfer their energy to the atmosphere thus exciting the atoms and molecules to higher energy states. When they relax back down to lower energy states, they release their energy in the form of light. This is similar to how a neon light works. The aurora typically forms 80 to 500 km above Earth’s surface.
A geomagnetic storm is a major disturbance of Earth's magnetosphere that occurs when there is a very efficient exchange of energy from the solar wind into the space environment surrounding Earth. These storms result from variations in the solar wind that produces major changes in the currents, plasmas, and fields in Earth’s magnetosphere. The solar wind conditions that are effective for creating geomagnetic storms are sustained (for several to many hours) periods of high-speed solar wind, and most importantly, a southward directed solar wind magnetic field (opposite the direction of Earth’s field) at the dayside of the magnetosphere. This condition is effective for transferring energy from the solar wind into Earth’s magnetosphere.
The largest storms that result from these conditions are associated with solar coronal mass ejections (CMEs) where a billion tons or so of plasma from the sun, with its embedded magnetic field, arrives at Earth. CMEs typically take several days to arrive at Earth, but have been observed, for some of the most intense storms, to arrive in as short as 18 hours. Another solar wind disturbance that creates conditions favorable to geomagnetic storms is a high-speed solar wind stream (HSS). HSSs plow into the slower solar wind in front and create co-rotating interaction regions, or CIRs. These regions are often related to geomagnetic storms that while less intense than CME storms, often can deposit more energy in Earth’s magnetosphere over a longer interval.
Storms also result in intense currents in the magnetosphere, changes in the radiation belts, and changes in the ionosphere, including heating the ionosphere and upper atmosphere region called the thermosphere. In space, a ring of westward current around Earth produces magnetic disturbances on the ground. A measure of this current, the disturbance storm time (Dst) index, has been used historically to characterize the size of a geomagnetic storm. In addition, there are currents produced in the magnetosphere that follow the magnetic field, called field-aligned currents, and these connect to intense currents in the auroral ionosphere. These auroral currents, called the auroral electrojets, also produce large magnetic disturbances. Together, all of these currents, and the magnetic deviations they produce on the ground, are used to generate a planetary geomagnetic disturbance index called Kp. This index is the basis for one of the three NOAA Space Weather Scales, the Geomagnetic Storm, or G-Scale, that is used to describe space weather that can disrupt systems on Earth.
During storms, the currents in the ionosphere, as well as the energetic particles that precipitate into the ionosphere add energy in the form of heat that can increase the density and distribution of density in the upper atmosphere, causing extra drag on satellites in low-earth orbit. The local heating also creates strong horizontal variations in the in the ionospheric density that can modify the path of radio signals and create errors in the positioning information provided by GPS. While the storms create beautiful aurora, they also can disrupt navigation systems such as the Global Navigation Satellite System (GNSS) and create harmful geomagnetic induced currents (GICs) in the power grid and pipelines.
The NOAA Space Weather Scales were introduced as a way to communicate to the general public the current and future space weather conditions and their possible effects on people and systems. Many of the SWPC products describe the space environment, but few have described the effects that can be experienced as the result of environmental disturbances. These scales are useful to users of our products and those who are interested in space weather effects. The scales describe the environmental disturbances for three event types: geomagnetic storms, solar radiation storms, and radio blackouts. The scales have numbered levels, analogous to hurricanes, tornadoes, and earthquakes that convey severity. They list possible effects at each level. They also show how often such events happen, and give a measure of the intensity of the physical causes.
Source Space Weather Prediction Center